

You scroll YouTube for five minutes and come away more confused than before. One analyst says Bitcoin hits $200K by mid-2026. Another says we’re heading into a brutal bear market and $20K is realistic. Both sound confident. Both have charts.
So you freeze. You do nothing. Or worse — you panic-buy at the top or panic-sell at the bottom.
That’s not stupidity. That’s what happens when you have no filter for separating signal from noise.
This article won’t give you a single magic price target. Anyone who does that is either guessing or selling something. What it will give you is a three-factor framework for forming your own realistic Bitcoin price prediction for 2026 — one grounded in history, macro data, and on-chain signals.
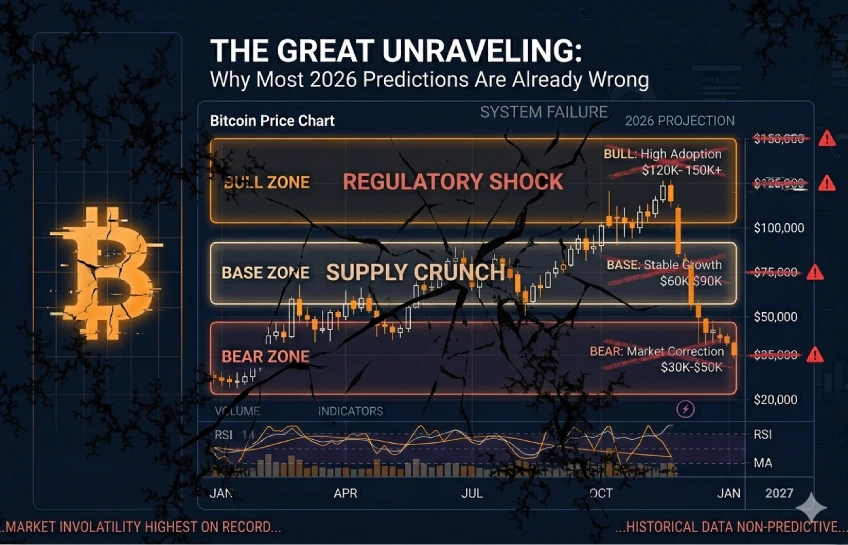
Why Most 2026 Predictions Are Already Wrong
The biggest problem with Bitcoin price predictions isn’t that analysts are dishonest. It’s that most of them think in straight lines.
They take Bitcoin’s recent trajectory, extend it forward, and call it a forecast. That’s not analysis — that’s drawing with a ruler. Markets don’t move in straight lines. They move in cycles shaped by supply changes, liquidity conditions, and human behavior.
The other problem is timeframe bias. A prediction made in January 2026 will be wildly different from one made in June 2026, even if both reference “2026.” Bitcoin can swing 40% in a month. Pinning a single number to an entire year ignores that completely.
And then there’s the macro blind spot. Most crypto analysts live inside the crypto bubble. They track Bitcoin dominance and exchange flows, but ignore what the Federal Reserve is doing with interest rates, or whether global liquidity is tightening. Those things matter enormously — as 2022 showed when the Fed’s rate hikes crushed Bitcoin from $69K to under $16K.
The 3-Factor Framework
Instead of chasing a price target, use these three factors together. No single factor tells the full story. Combined, they give you a much clearer picture.
Factor 1: Post-Halving Historical Range
Bitcoin’s April 2024 halving cut the block reward from 6.25 BTC to 3.125 BTC. This matters because it reduces the rate at which new Bitcoin enters circulation. Miners sell less. Supply pressure drops.
Looking at previous cycles:
- After the 2012 halving, Bitcoin peaked roughly 12–18 months later.
- After the 2016 halving, the peak came around 18 months out — in December 2017.
- After the 2020 halving, the peak arrived around 18 months later — in November 2021.
If that pattern holds, the 2024 halving points to a potential cycle top somewhere between late 2025 and early-to-mid 2026. That doesn’t mean the price will keep climbing through all of 2026 — it may peak and then start pulling back.
This is why Bitcoin price prediction 2026 isn’t a single number. 2026 could capture both the peak of one cycle and the early decline of the next bear phase, depending on when you’re looking.
Historical data from LookIntoBitcoin and Glassnode shows that post-halving cycle peaks have consistently produced 4x–6x gains from the pre-halving price. At a pre-halving price around $60K–$70K, that math puts a cycle top somewhere between $150K and $300K — but timing is everything, and those upper ranges represent the most optimistic conditions.
Factor 2: Macro Environment
This one gets ignored more than it should.
Bitcoin doesn’t trade in a vacuum. When the Federal Reserve raises interest rates, risk assets — including crypto — tend to fall. When rates drop and liquidity returns to markets, speculative assets tend to rise.
Right now, the Fed’s rate trajectory matters more than any Bitcoin-specific factor. If rates are cut meaningfully before or during 2026, that creates favorable conditions for Bitcoin. If inflation reignites and the Fed stays tight, expect headwinds.
Dollar strength is the other piece. Bitcoin is priced in dollars. A weaker dollar typically supports higher Bitcoin prices — not because Bitcoin changed, but because you need more dollars to buy the same amount of it.
Watch the DXY (Dollar Index) and Fed meeting outcomes through 2025 and into 2026. These are leading indicators most retail investors skip entirely.
Factor 3: On-Chain Signals
This is where you separate the tourists from the people who actually understand what’s happening.
Three on-chain metrics worth tracking:
MVRV Ratio (Market Value to Realized Value): This compares Bitcoin’s current market cap to the price everyone paid when they last moved their coins. When MVRV is very high (above 3.5), the market is historically overheated — past cycle tops have occurred in this zone. When it’s below 1, coins are trading below their cost basis, which is typically a strong long-term entry signal. You can track this on Glassnode or LookIntoBitcoin.
Reserve Risk: Measures how much confidence long-term holders have. When it’s low, long-term holders are holding rather than selling — a bullish signal. When it spikes high, seasoned investors are distributing to new buyers.
HODL Waves: Show what percentage of Bitcoin hasn’t moved in 1+ years. When older coins start moving (meaning long-term holders are selling), it often signals the later stages of a bull cycle.
None of these tell you tomorrow’s price. But together, they tell you where in the cycle you likely are.
Realistic 2026 Scenarios
Here’s how the three factors combine into outcomes you can actually plan around.
Bull Case: $120K–$180K
This assumes: post-halving demand continues building, the Fed cuts rates meaningfully in late 2025, institutional buying accelerates through ETFs, and on-chain data doesn’t show major distribution. In this scenario, 2026 captures the later stages of the bull cycle — potentially the peak. If you’re holding Bitcoin, this is where you’d want to have a profit-taking plan in place.
Base Case: $55K–$90K
This is the most likely range if macro conditions stay mixed — rates cut slowly, no major economic shock, steady but not explosive retail participation. Bitcoin trades in a wide band, some months exciting, some frustrating. Long-term holders do fine. Traders lose money trying to time it.
Bear Case: $28K–$42K
This happens if the macro environment turns ugly — a recession, a credit event, regulatory crackdown, or the halving cycle simply plays out faster than expected and 2026 lands in the post-peak correction. This scenario has happened before. It’s uncomfortable, but it’s not the end of Bitcoin.
What to Actually Do in Each Scenario
Knowing the scenarios is useless without a plan.
In a bull case: Don’t let euphoria make you greedy. Take partial profits at meaningful levels ($100K, $130K, $150K). Keep a portion for the long term if you believe in Bitcoin’s 10-year trajectory. Don’t use leverage near the top — it’s how people turn winning trades into disasters.
In a base case: Dollar-cost averaging (DCA) works well here. Regular, fixed purchases remove the emotional burden of timing. Don’t check the price daily. Set a monthly check routine instead.
In a bear case: The worst thing you can do is panic-sell at $30K after buying at $70K. If your position size was right to begin with — meaning a loss at $30K doesn’t ruin your life — then holding through a bear market has historically been rewarded. The people who sold at $16K in 2022 and bought back at $40K in 2023 understand this now.
Common Traps That Cost People Money
Buying at peaks driven by social media hype (late 2021 was a textbook example of this). Selling during the panic when every headline says crypto is dead (late 2022). Using leverage because you’re “sure” about a direction. Listening to influencers who profit from your trades, not your returns.
The pattern is almost always the same: buy high when excitement is everywhere, sell low when fear takes over. The framework above exists specifically to break that cycle.
A Simple Monthly Check Routine
You don’t need to obsess over charts. Once a month, spend 20 minutes on:
- Check where MVRV is — overheated, neutral, or undervalued?
- Check the Fed’s latest statement — any change in rate trajectory?
- Check Bitcoin dominance — is money flowing into altcoins (late cycle signal) or staying in Bitcoin?
That’s it. Three data points. Adjust your plan if any of them shift significantly.
FAQs
Will Bitcoin reach $100K by 2026? It’s plausible in a bull case — especially if post-halving demand builds and macro conditions support it. It’s not guaranteed. History suggests the range around a cycle top is wide, and timing matters more than the target.
Is a crypto winter possible in 2026? Yes. If the cycle peaks in late 2025 or early 2026, the back half of 2026 could see a meaningful correction. This has followed every prior halving cycle to some degree.
Should I buy Bitcoin now or wait? That depends on your time horizon and risk tolerance. If you’re planning to hold for 3–5 years, timing a single entry matters less. If you’re thinking in months, you’re speculating — and the three-factor framework helps you understand where we likely are in the cycle.
What on-chain tools can I use? Glassnode (paid, institutional-grade), LookIntoBitcoin (free, great for cycle indicators), and CoinMetrics (good for fundamentals and network data).
How reliable are halving cycle predictions? Three data points (2012, 2016, 2020) is a small sample size. Treat the pattern as a useful historical reference, not a law of nature. As more institutional money enters the market, cycle dynamics will likely change over time.
Make Your Plan Now
The worst time to figure out your Bitcoin strategy is during a price spike or a crash. Both states cloud judgment.
The crypto market cycle 2026 will create real opportunities — and real traps. Which one catches you depends on whether you have a plan before things get emotional.
Use the three-factor framework. Set your scenarios. Know what you’ll do in each one. Then let the market do whatever it’s going to do — because it will, with or without your permission.
Other Articles

How to Get a Competitive Edge in The Serpent Rogue
iPhone 18 Release Date & Specs: Pro, Foldable & What’s New

No Comment! Be the first one.